Some cases are too complex to describle with mathmatical formulas, so we need to analyze data points. Here are the tasks:
- Fitting a selected model type or types to the data.
- Choosing the best fitted model.
- Making predicitons.
Relationship Between Model Fitting and Interpolation
Model Fitting involves finding a mathmatical function that best represents the given data. It doesn’t necessarily pass through all the data points. Interpolation involves finding a function that exactly passes through all the data points.
Sources of Error in the Modeling Process
- Formulation error Formulation error presents in all the models when certain variables are negligible or simplifed in the assumption.
- Truncation error Truncation error occors when numerical methods used to solve mathmatical problems cause inacurated errors.
- Round-off error Round-off error happens when infinit digit cannot be represented exactly using finit digits.
- Measurement error Measurement error is caused by inaccurate data collaction.
3.1 Fitting Models to Data Graphically
Models need as many data points in the model curve.
The spacing of the data points within that interval is also important.
Accuracy of the data points need to be appraised everytime before fitiing the model.
Visual Model Fitting with the Original Data
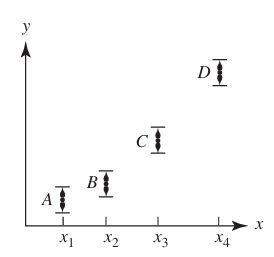
Generally, when more than two data points exist, some points are not lied on a same line. There will be vertical distances between inaccurate points and the line. We call these vertical distances absolute deviations. For the best-fitiing line, we aim to minimize the sum of these absolute deviations. However, some large absolute deviations will impact the line a lot. A line that minimizes the largest deviation from any point is an alternative.
Transforming the Data
Sometimes the relationships are complex, thus the graphs are difficult to draw. In order to draw simpler graphs, we can put not only x ot y on the x-axis or y-axis, but also functions or relations about x and y. This need some more mathematical processes but will come up with simpler results, such as straight lines.
3.2 Analytic Methods of Model Fitting
Chebyshev Approximation Criterion
Chebyshe Approximation Criterion is used to minimize the largest absolute deviation. Given a function and a collection of data points . Minimizes the number
Redidual is difference between true value and measured value. Note that rediduals can be positive or negative, but absolute deviations are always positive. For every data point, there is a residual . The largest absolute value among all is called , and we aim to minimize . The needs to meet:
can be expressed by and .
The weakness of Chebyshev Approximation Criterion is that it gives more weight to a single point with large deviation.
Minimizing the Sum of the Absolute Deviations
Given a function and a collection of data points . Then we want to minimize
represent each absolute deviation. We want to minimize by adding together the number .
Least Squares Criterion
Given a function and a collection of data points . Then we want to minimize
. Consider are scalar components of a deviation vector. In other word, we want to make vector, , as short as possible.
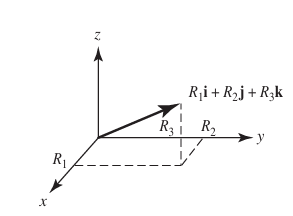 The formula to calculate this deviation vector is
In order to minimize , we can minimize .
Relating the Criteria
Combining Chebyshev Approximation Criterion and Least Squares Criterion.
The absolute deciations according to Chebyshev Approximation Criterion are: Define the largest absolute deviations is , which we want to minimize.
The absolute deciations according to Least Squares Criterion are:
Define the largest absolute deviations is . Note:
According to the definition of Least Squares Criterion, the sum of is the smallest, so:
Since , therefore,
Isolate by following formula:
For ease of discussion, define
Thus,
D \leq c_{max} \leq d_{max} $$If $|D - d_{max}|$ is too large, Chebyshev Approximation Criterion will be better than Least Squares Criterion.